
$ in billions
$ in millions
(as adjusted)
(as adjusted)
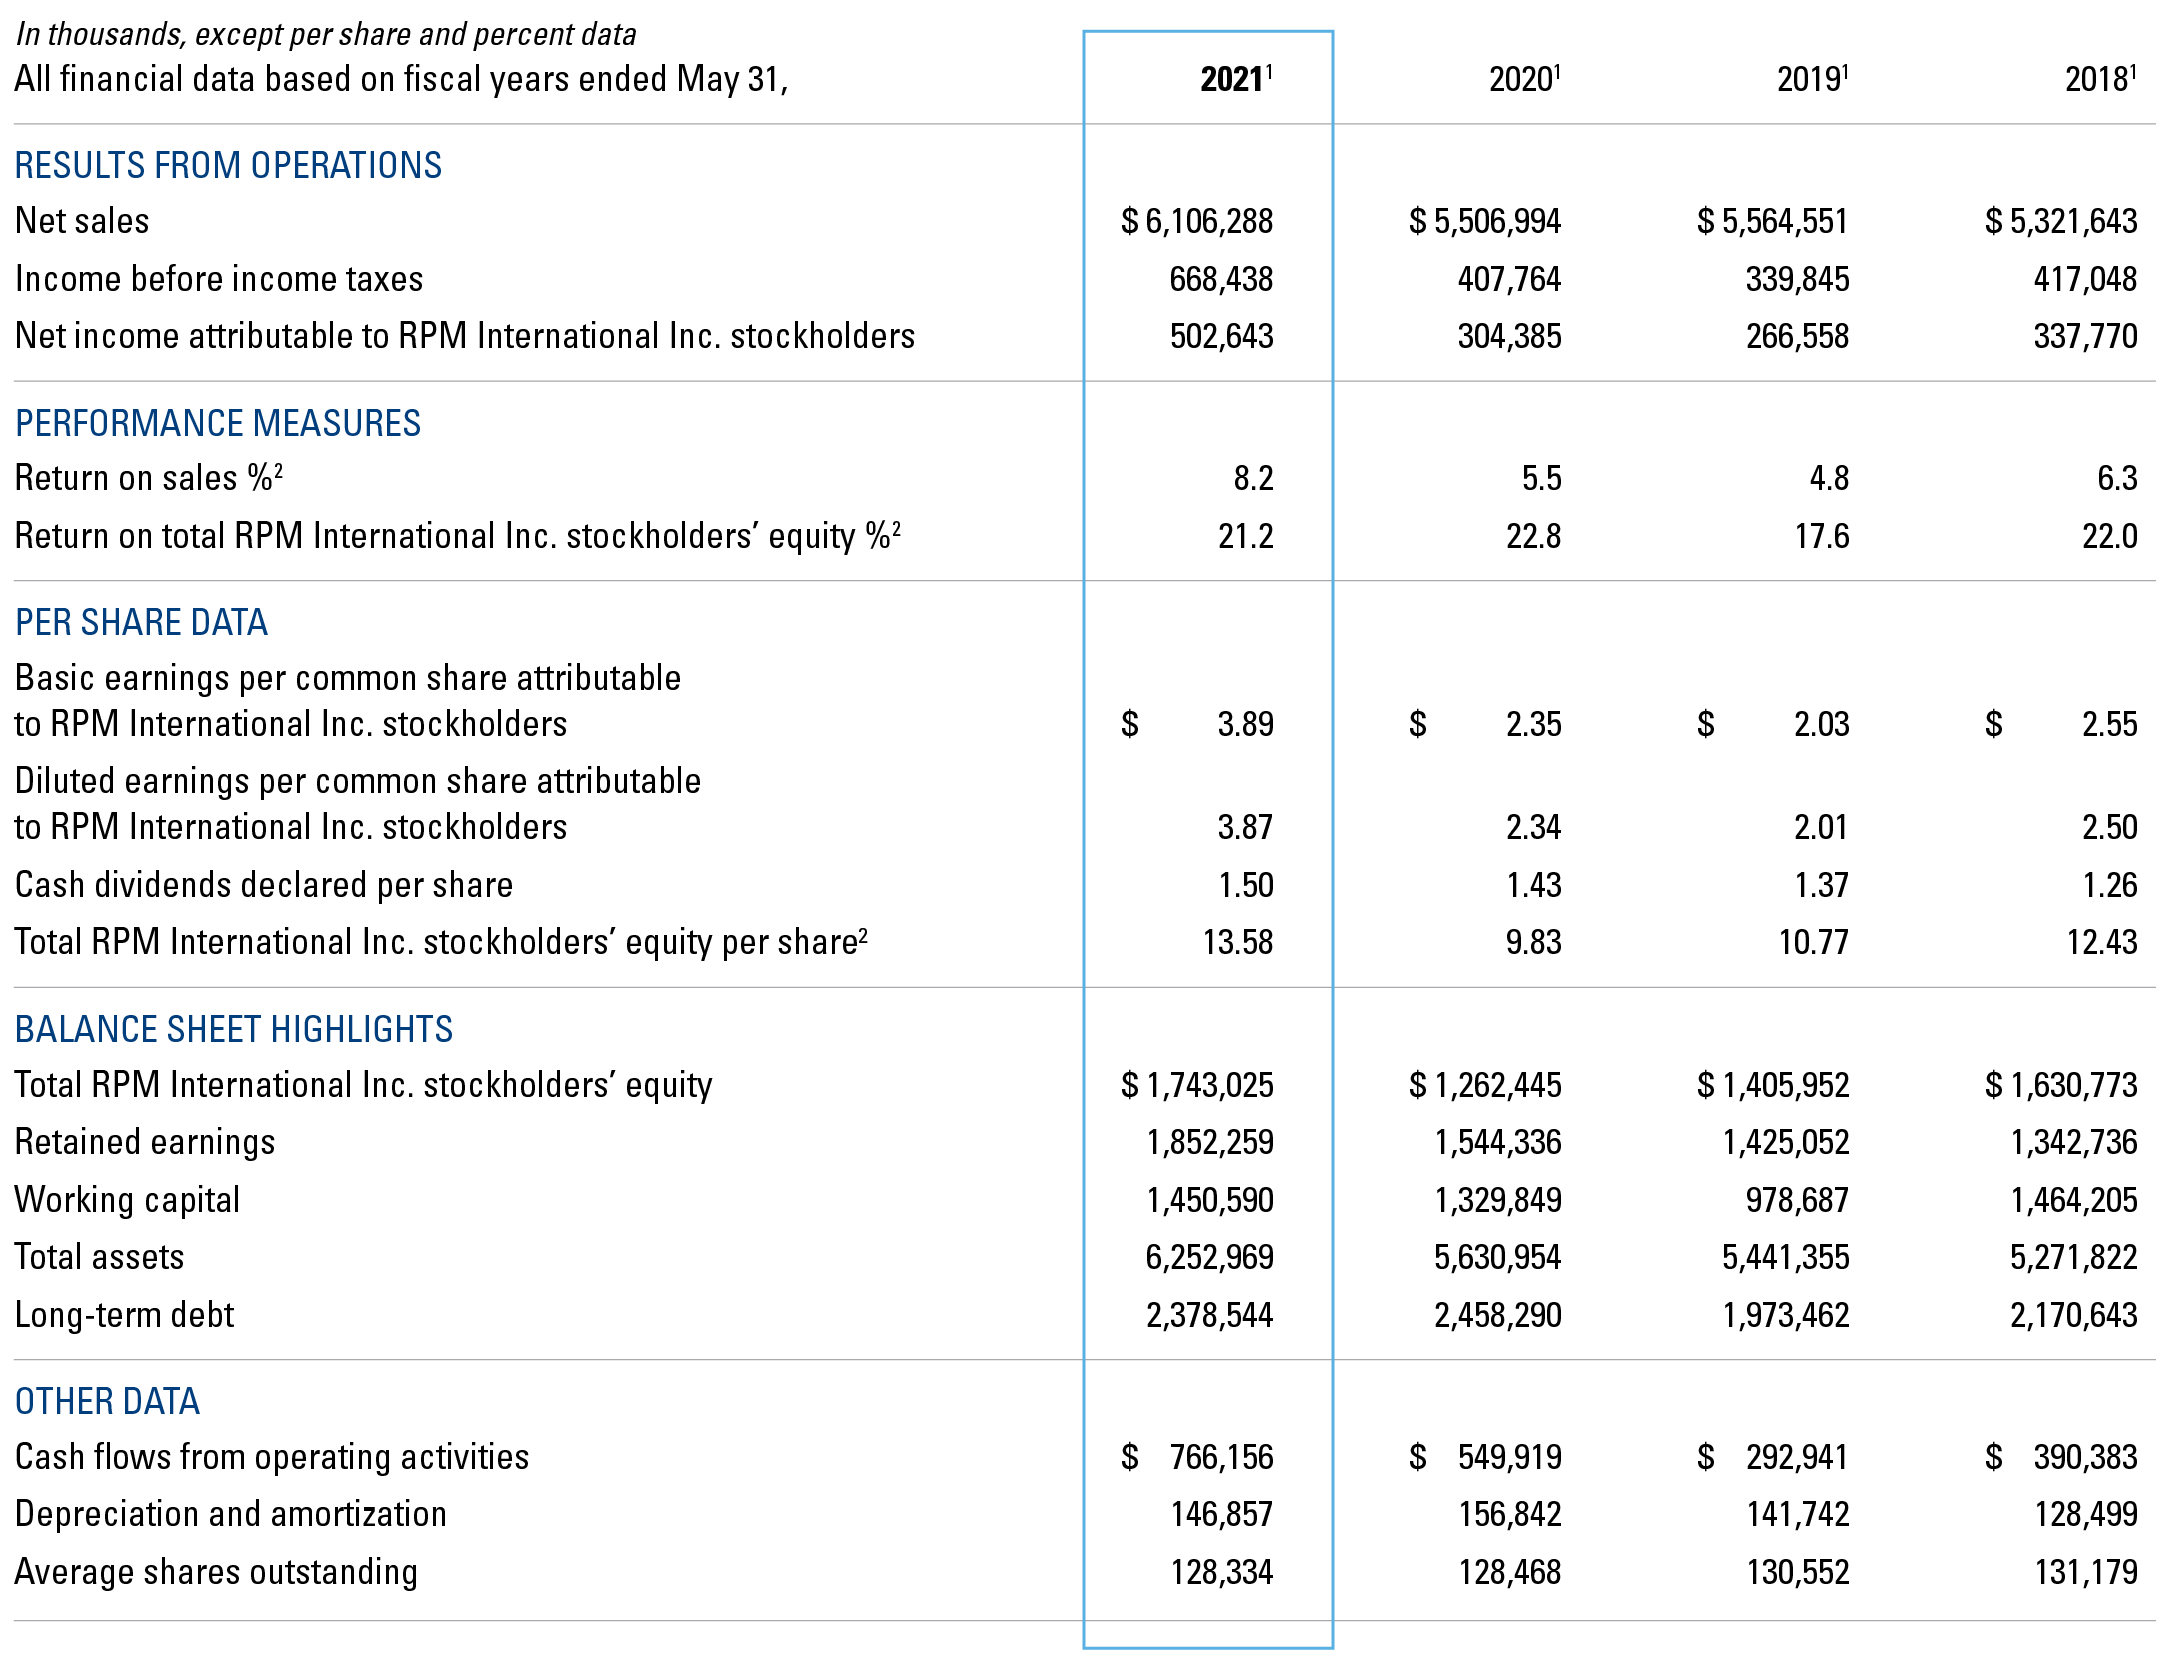
1. Consolidated figures presented in the table on page 22 reflect as-reported data. Refer to the accompanying adjusted data charts provided in conjunction with the explanatory footnotes below for a discussion of the items not indicative of ongoing operations. • Acquisitions made by the company during the periods presented may impact comparability from year to year. • Certain reclassifications have been made to prior-year amounts to conform to the current-year presentation. • See Notes to Consolidated Financial Statements.
2. Return on sales % is calculated as net income (loss) attributable to RPM International Inc. stockholders divided by net sales; return on total RPM International Inc. stockholders’ equity % is calculated as net income (loss) attributable to RPM International Inc. stockholders divided by the average of the current and prior year total RPM International Inc. stockholders’ equity; and total RPM International Inc. stockholders’ equity per share is calculated as total RPM International Inc. stockholders’ equity divided by average shares outstanding.
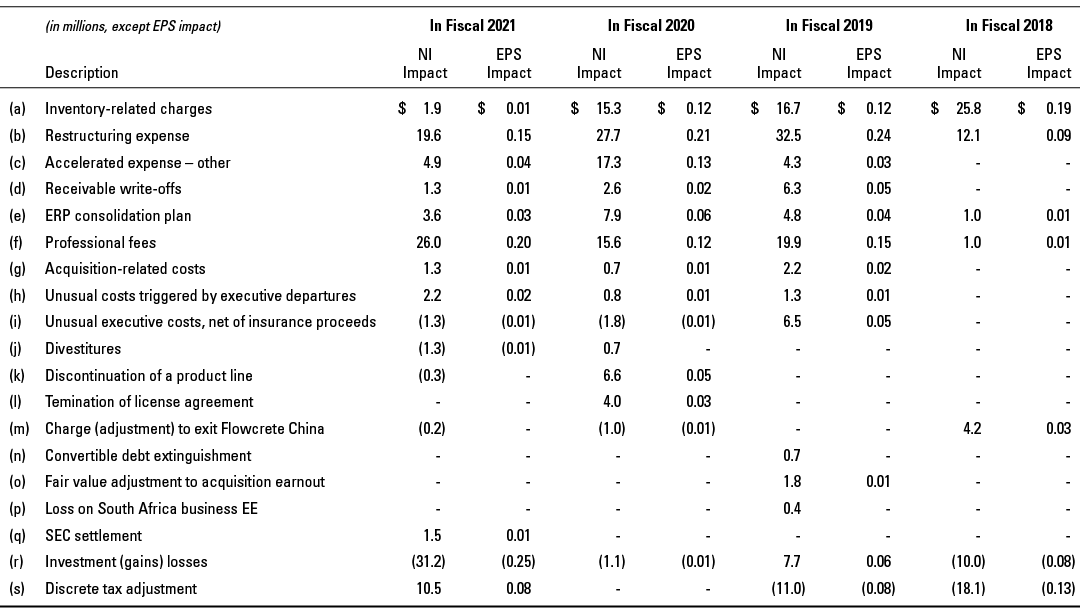
3. Adjusted results exclude:
